


1035 Capital: Small Cap Report
Week #25

We hope you are enjoying the free preview of our Small Cap Report. The complete report is a comprehensive view of the small cap market and features proprietary and hard to access data from across the small cap landscape!
This report focuses on the sector and industries moves within small cap each week, then provide the top performing small cap stocks by sector as well as a Movers & Shakers list similar to our Weekly Update Movers & Sakers report. This is the perfect way for small cap investor to prepare for the week ahead.
I hope you are enjoying the 1035 Capital free Small Cap Report. To access the other proprietary and hard to come by data, upgrade to a paid subscription. Check out our free previews of the data we provide in this report! Our full update is packed with so much data that Substack can’t handle it all, so we have to send it directly from our server to your email!
Do you know anyone else who would enjoy this content? Use the share button below to show someone how much you care about their performance!

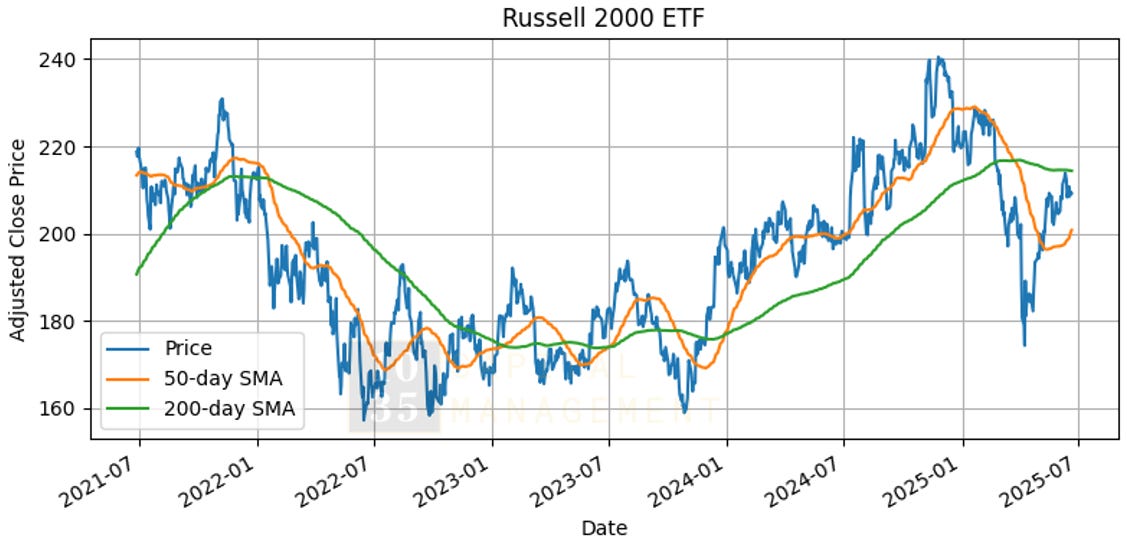
Small Cap Market at a Glance


Small Cap Sector Movers


Percent of the Small Cap Index above MA


Small Cap Sector Performance (Bob’s Bingo Scores)
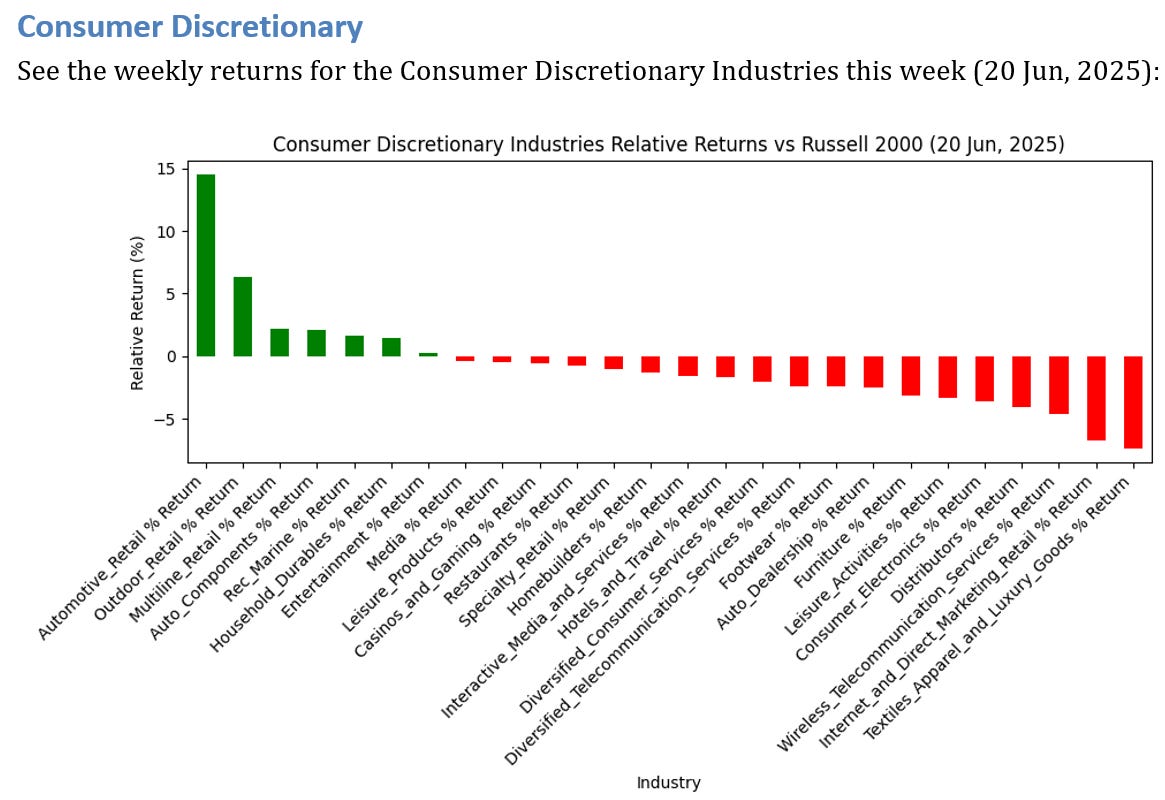
See below for the weekly performance of 26 Consumer Discretionary Industries.
Volatility Warnings
No significant volatility detected this week.
2 Consumer Discretionary Industries OUTPERFORMED the Russell 2000 by >3%
7 Consumer Discretionary Industries UNDERPERFORMED the Russell 2000 by >3%
Top Industry This Week
Industry: Automotive_Retail
Weekly Relative Return: 14.49%
Number of Tickers: 6
Ticker List: $EVGO $CRGE $VLTA $TA $CASY $MNRO
Bottom Industry This Week
Industry: Textiles_Apparel_and_Luxury_Goods
Weekly Relative Return: -7.39%
Number of Tickers: 28
Ticker List: $ANF $HBI $COLM $VNCE $VRA $CULP $UAA $MOV $GIII $UFI $FOSL $KTB $PVH $OXM $ZGN $CRI $AEO $EXPR $TLYS $DBI $CTRN $ZUMZ $CHS $URBN $VSCO $JILL $CURV GES 0.00%↑

See below for the weekly performance of 6 Consumer Staples Industries.
Volatility Warnings
No significant volatility detected this week.
0 Consumer Staples Industries OUTPERFORMED the Russell 2000 by >3%
0 Consumer Staples Industries UNDERPERFORMED the Russell 2000 by >3%
Top Industry This Week
Industry: Food_Products
Weekly Relative Return: 1.95%
Number of Tickers: 25
Ticker List: $SOVO $THS $FDP $FARM $NOMD $OTLY $DOLE $LMNR $AVO $JJSF $LANC $ALCO $BHIL $HAIN $SENEA $TR $BGS $UTZ $CVGW $CALM $BYND $JBSS $AGRO $BRCC $STKL
Bottom Industry This Week
Industry: Food_and_Staples_Retailing
Weekly Relative Return: -2.87%
Number of Tickers: 13
Ticker List: $SPTN $APRN $WMK $DDL $VLGEA $IMKTA $UNFI $GO $SFM $NGVC $PSMT $CHEF $ANDE
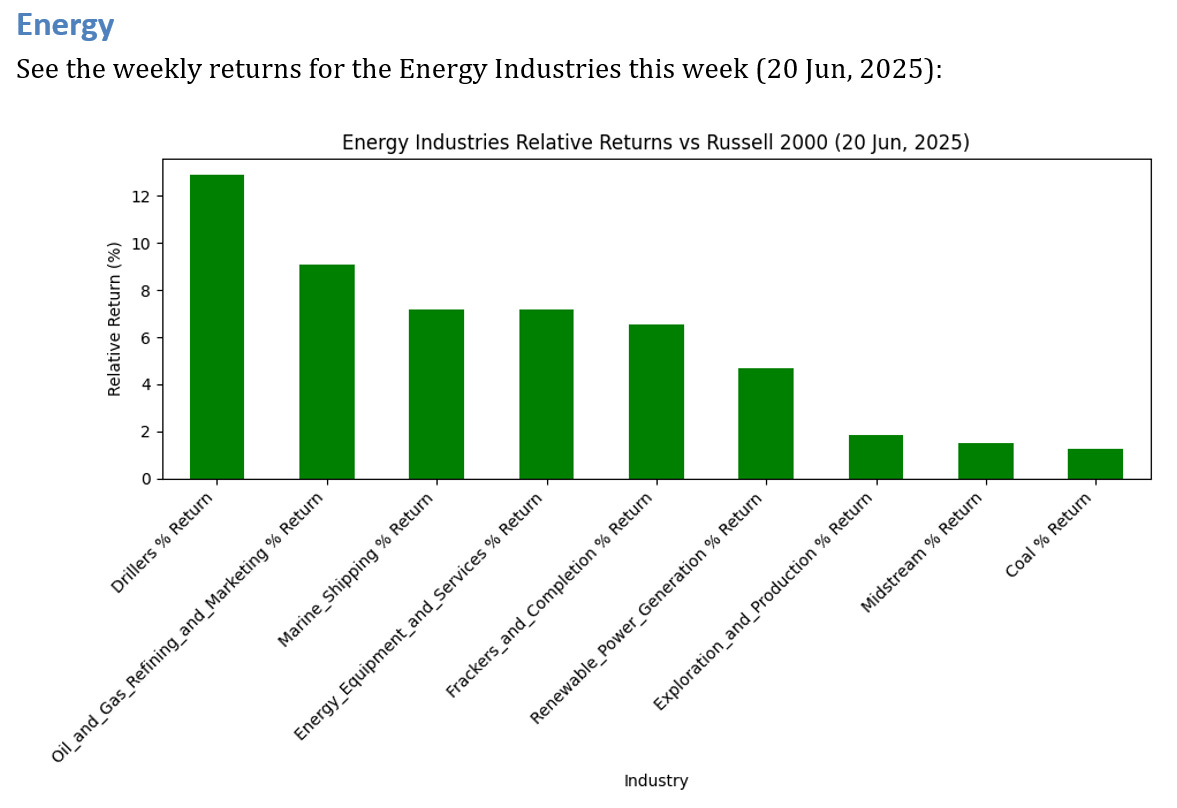
See below for the weekly performance of 9 Energy Industries.
Volatility Warnings
Warning: 6 industries OUTPERFORMED, 1 std dev above mean (2.2)
6 Energy Industries OUTPERFORMED the Russell 2000 by >3%
0 Energy Industries UNDERPERFORMED the Russell 2000 by >3%
Top Industry This Week
Industry: Drillers
Weekly Relative Return: 12.92%
Number of Tickers: 11
Ticker List: $HP $OIS $NE $PTEN $VAL $RNGR $DO $XPRO $RIG $FET $NBR
Bottom Industry This Week
Industry: Coal
Weekly Relative Return: 1.25%
Number of Tickers: 9
Ticker List: $NC $ARCH $NRP $BTU $ARLP $METC $AREC $AMR HCC 0.00%↑

See below for the weekly performance of 20 Financials Industries.
Volatility Warnings
No significant volatility detected this week.
Insurance_Brokers % Return
-3.55
0 Financials Industries OUTPERFORMED the Russell 2000 by >3%
1 Financials Industries UNDERPERFORMED the Russell 2000 by >3%
Top Industry This Week
Industry: Real_Estate_Management_and_Development
Weekly Relative Return: 2.3%
Number of Tickers: 26
Ticker List: $HHC $OPEN $RMAX $HOUS $STRS $DOUG $DOMA $RDFN $ARL $FRPH $COMP $MMI $ASPS $FOR $TCI $FPH $NMRK $SRG $CWK $KW $JOE $WE $OPAD $XIN $TRC $AXR
Bottom Industry This Week
Industry: Insurance_Brokers
Weekly Relative Return: -3.55%
Number of Tickers: 4
Ticker List: $SLQT $BRP $WDH GSHD 0.00%↑

See below for the weekly performance of 9 Healthcare Industries.
Volatility Warnings
No significant volatility detected this week.
2 Healthcare Industries OUTPERFORMED the Russell 2000 by >3%
1 Healthcare Industries UNDERPERFORMED the Russell 2000 by >3%
Top Industry This Week
Industry: Life_Sciences_Tools_and_Services
Weekly Relative Return: 5.0%
Number of Tickers: 11
Ticker List: $ADPT $AZTA $LAB $CTKB $PACB $TXG $CDXS $MRVI $ABCL $AKYA $STVN
Bottom Industry This Week
Industry: Health_Care_Technology
Weekly Relative Return: -6.77%
Number of Tickers: 20
Ticker List: $AMWL $CNVY $SHCR $EVH $DH $SDGR $SOPH $PHR $NH $MDRX $MPLN $SLP $HSTM $HCAT $CERT $GDRX $NXGN $BBLN $LFMD OPRX 0.00%↑

See below for the weekly performance of 12 Producer Durables Industries.
Volatility Warnings
No significant volatility detected this week.
0 Producer Durables Industries OUTPERFORMED the Russell 2000 by >3%
1 Producer Durables Industries UNDERPERFORMED the Russell 2000 by >3%
Top Industry This Week
Industry: Air_Freight_and_Logistics
Weekly Relative Return: 2.81%
Number of Tickers: 5
Ticker List: $HUBG $AAWW $BEST $ATSG $FWRD
Bottom Industry This Week
Industry: Airlines
Weekly Relative Return: -5.56%
Number of Tickers: 11
Ticker List: $MESA $SAVE $UP $CPA $ULCC $ALGT $SKYW $SNCY $JBLU $HA CAAP 0.00%↑
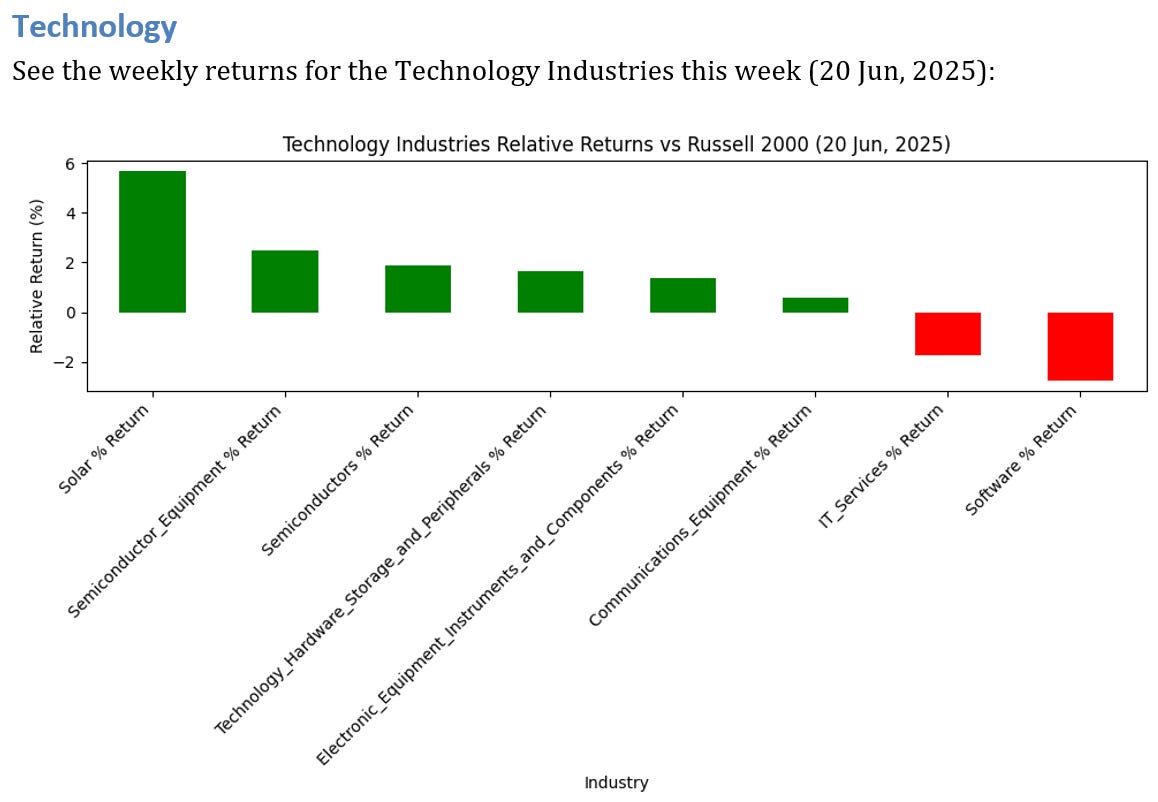
See below for the weekly performance of 8 Technology Industries.
Volatility Warnings
No significant volatility detected this week.
1 Technology Industries OUTPERFORMED the Russell 2000 by >3%
0 Technology Industries UNDERPERFORMED the Russell 2000 by >3%
Top Industry This Week
Industry: Solar
Weekly Relative Return: 5.66%
Number of Tickers: 11
Ticker List: $MAXN $JKS $ENPH $SEDG $CSIQ $SPWR $FSLR $RUN $ARRY $GNRC $SHLS
Bottom Industry This Week
Industry: Software
Weekly Relative Return: -2.73%
Number of Tickers: 109
Ticker List: $MTLS $PD $PEGA $SMWB $BLKB $INST $RNG $IREN $XPER $RAMP $FROG $SMAR $NTNX $ENV $ALRM $KLR $TDC $QTWO $EVCM $YOU $NEWR $PRGS $VRNS $EGHT $CGNT $XNET $BOX $MGIC $SNCR $ALTR $PING $MSTR $MODN $IS $SUMO $MLNK $ETWO $DSP $DMRC $MNTV $WKME $BLND $RSKD $BASE $CVLT $ALLT $NCNO $ASAN $LVOX $IDCC $SEAC $ALKT $CXM $API $FRSH $ENFN $BTRS $GREE $BTCM $TENB $USER $ESMT $AVPT $ONTF $SEMR $SPNS $LPSN $DCT $TUYA $DV $FORG $LAW $AI $ZUO $SCWX $ZETA $EXFY $ATEN $OPRA $WEAV $CWAN $CCRD $BRZE $ECOM $MAPS $RNWK $COUP $LTCH $NABL $VRNT $PRO $YEXT $TUFN $RAAS $KNBE $CCSI $WK $JAMF $CMCM $CLBT $CRNC $SPSC $KLTR $AYX $INTA $AGYS $ACIW $BL OLO 0.00%↑

See below for the weekly performance of 9 Materials Industries.
Volatility Warnings
No significant volatility detected this week.
1 Materials Industries OUTPERFORMED the Russell 2000 by >3%
1 Materials Industries UNDERPERFORMED the Russell 2000 by >3%
Top Industry This Week
Industry: Steel
Weekly Relative Return: 3.39%
Number of Tickers: 12
Ticker List: $HAYN $RS $AP $ZEUS $CRS $USAP $ATI $WOR $RYI $MSB $SXC $MTL
Bottom Industry This Week
Industry: Paper_and_Forest_Products
Weekly Relative Return: -3.03%
Number of Tickers: 5
Ticker List: $CLW $RFP $SLVM $MERC LPX 0.00%↑
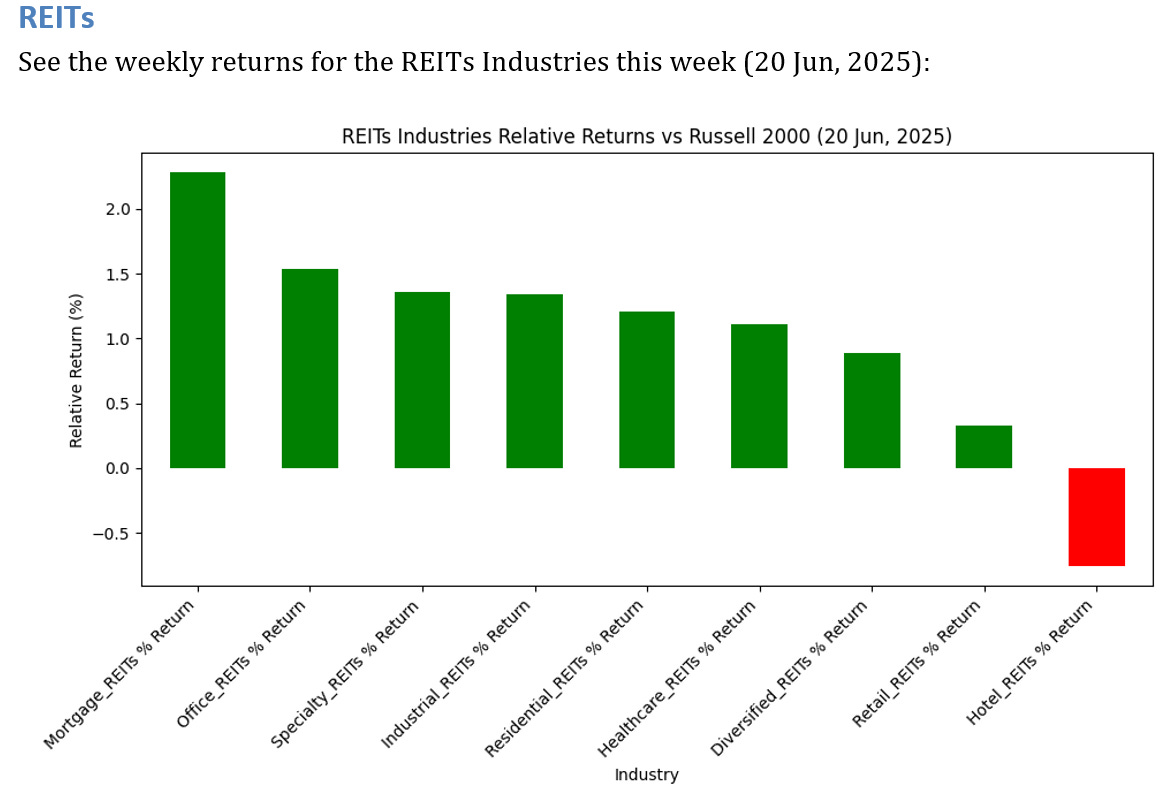
See below for the weekly performance of 9 REITs Industries.
Volatility Warnings
No significant volatility detected this week.
0 REITs Industries OUTPERFORMED the Russell 2000 by >3%
0 REITs Industries UNDERPERFORMED the Russell 2000 by >3%
Top Industry This Week
Industry: Mortgage_REITs
Weekly Relative Return: 2.28%
Number of Tickers: 27
Ticker List: $ABR $ACR $BRMK $CIM $RITM $HASI $CMTG $MITT $TWO $LADR $GPMT $MFA $EARN $ACRE $RWT $NREF $NYMT $RC $EFC $ARI $FBRT $PMT $CHMI $BRSP $TRTX $DX $KREF
Bottom Industry This Week
Industry: Hotel_REITs
Weekly Relative Return: -0.76%
Number of Tickers: 15
Ticker List: $RLJ $BHR $PK $SOHO $HT $XHR $INN $DRH $RHP $APLE $CLDT $SHO $SVC $PEB $AHT
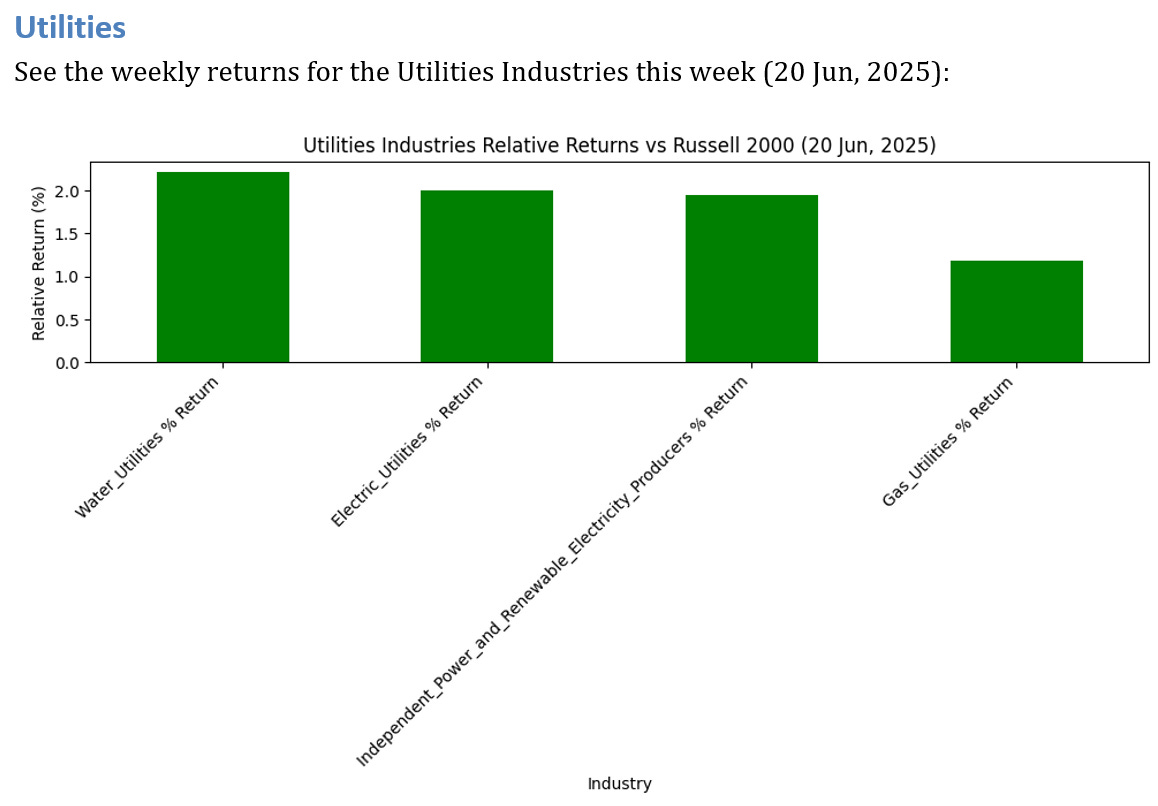
See below for the weekly performance of 4 Utilities Industries.
Volatility Warnings
No significant volatility detected this week.
0 Utilities Industries OUTPERFORMED the Russell 2000 by >3%
0 Utilities Industries UNDERPERFORMED the Russell 2000 by >3%
Top Industry This Week
Industry: Water_Utilities
Weekly Relative Return: 2.22%
Number of Tickers: 10
Ticker List: $UTL $NWE $AVA $CWCO $MSEX $ARTNA $AWR $YORW $CWT $CDZI
Bottom Industry This Week
Industry: Gas_Utilities
Weekly Relative Return: 1.19%
Number of Tickers: 7
Ticker List: $OGS $SGU $CPK $NJR $SR $SPH $NWN
Disclaimer: None of the information contained herein constitutes investment advice, performance data or any recommendation that any particular security, portfolio of securities, transaction or investment strategy is suitable for any specific person. Any mention of a particular security and related performance data is not a recommendation to buy or sell that security. Any opinions expressed herein do not constitute or imply endorsement, sponsorship, or recommendation by 1035 Capital Management or its employees.